61I want the app to find charts in my PDF
PDF Tools finds the charts in a pattern, and lights up the abbreviations on the page. It is a beta
- PDF Tools is a beta, and it is off to start with: Settings → Appearance → Beta Features → PDF Tools. It holds two switches, PDF Chart Detector and PDF Glossary Overlay.
- Finding charts also needs premium: the Charts button is only built in Smart Tracking and Full Knitting.
- A pattern PDF open in the reader. Nothing is sent anywhere. The page is read on your own device.
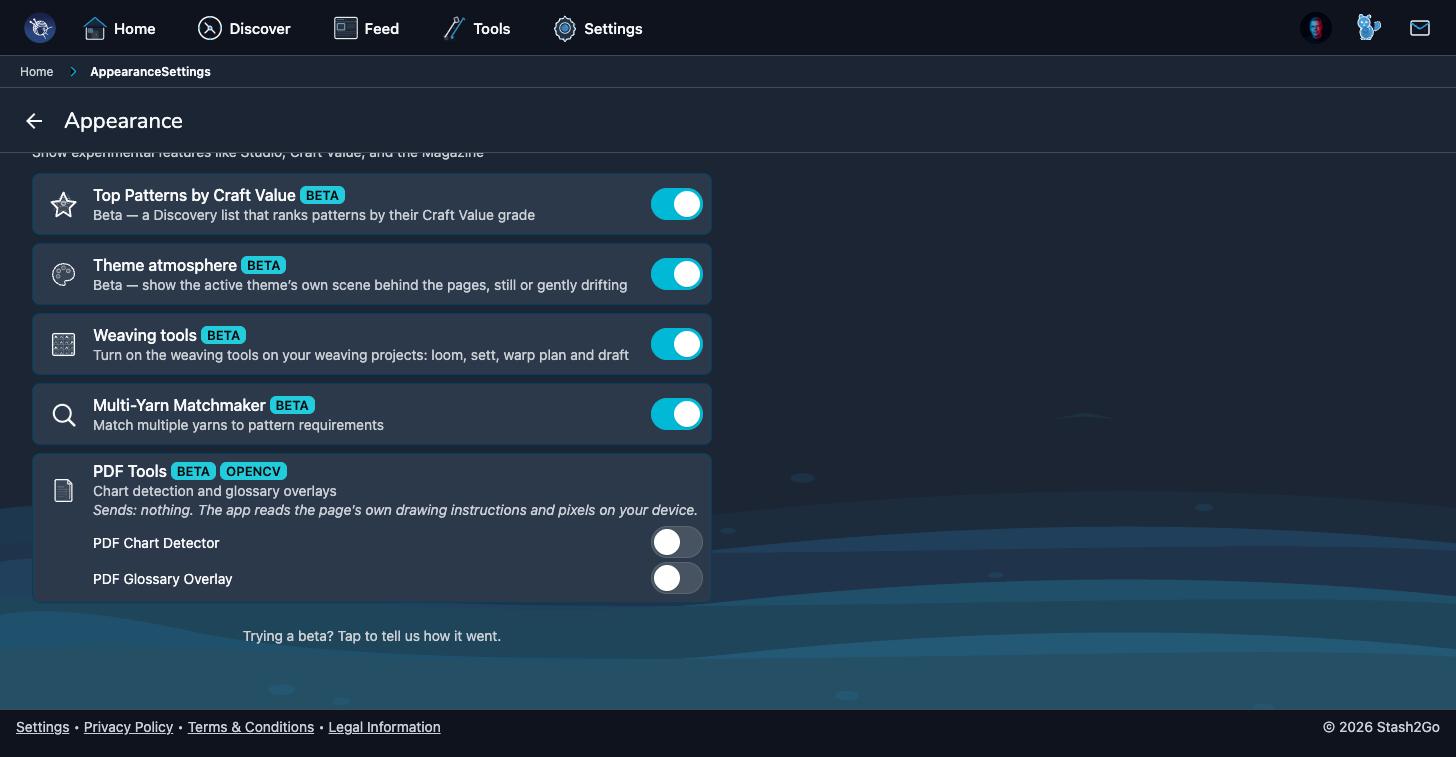
With the beta on and a premium plan, the toolbar gains Charts. Open it on a page that has a chart. It looks for charts and tables, then tells you how many rows it found and how sure it is.
A sensitivity slider decides how hard it looks. Lower catches fewer things that are not charts. Higher catches smaller or fainter ones. Move it and scan again. It is quick, and the right setting depends on how the designer drew the chart.
A chart it has found is drawn on top of the PDF page. Link it to a counter and the row you are on lights up where it really is, on the chart. Tap that lit row to move the counter on. The rows behind you shade in as the count goes up.
The second switch, PDF Glossary Overlay, marks glossary terms on the page itself. In the reader, Show terms turns the highlighting on and Hide terms takes it away again. So you can read the pattern plainly, then light up the abbreviations when a row stops making sense.
Available on iPhone, iPad, Android, and web at app.stash2go.com